
|

Poultry Industry Statistics and Reports
|
Broiler Month
|
11/25/2024 |
|
Monthly Broiler Production and Prices, November 2024.
Broiler Chick Placements.
According to the November 20th 2024 USDA Broiler Hatchery Reports, 1.210 million eggs were set over five weeks extending from the week ending October 19th 2024 through November 16th 2024 inclusive. This was four percent higher compared to the corresponding period in 2023.
Total chick placements for the U.S. over the five-week period amounted to 937.8 million chicks. Claimed hatchability for the period averaged 79.7 percent for eggs set three weeks earlier, down 0.1 percent from the preceding five-week period. Each 1.0 percent change in hatchability represents approximately 1.93 million chicks placed per week and 1.83 million broilers processed, assuming five percent culls and mortality and with the current range of weekly settings.
Cumulative chick placements for the period January 7th through December 30th 2023 amounted to 9.67 billion chicks. For January 6th through November 16th 2024 chick placements attained 8.70 billion, up two percent from the corresponding week in 2023.
According to the November 22nd 2024 edition of the USDA Chickens and Eggs, pullet breeder chicks hatched and intended for U.S. placement during October 2024 amounted to 8.05 million, up 0.6 percent (47,000 pullet chicks) from October 2023 and 10.1 percent (1.787 million pullet chicks) more than the previous month of September 2024. Broiler breeder hen complement attained 61.45 million on October 1st 2024, 2.0 percent (1.27 million hens) more than on October 1st 2023.
Broiler Production
As documented in the November 20th 2024 USDA Broiler Market News Reports for the processing week ending November 16th 2024, 169.9 million broilers were processed at 6.49 lbs. live. This was 0.2 percent more than the 168.6 million broilers processed during the corresponding week in the previous month of October 2024 and 1.9 percent more than the 166.8 million processed during the corresponding week in November 2023. Broilers processed in 2024 to date amounted to 7,569 million, 1.3 percent lower than for the corresponding period in 2023.
Ready to cook (RTC) weight for the most recent week in November was 845.9 million lbs. (384,510 metric tons). This was 0.7 percent less than the 852.2 million lbs. processed during the corresponding week in October 2024 and 2.8 percent more than the 822.6 million lbs. during the corresponding week in November 2023. Dressing percentage was a nominal 76.0 percent. For 2024 to date RTC broiler production attained 37,455 million lbs. (17.03 million metric tons). This quantity was 0.6 percent more than for the corresponding period in 2023.
Broiler Prices
The USDA National Composite Weighted Wholesale price for the week ending November 22nd 2024 was down 0.8 cents per lb. to 128.0 cents per lb. from the corresponding week in October 2024. The attached USDA figures denote average prices over three-years.
Leading QSRs are using increasing quantities of breast meat for sandwiches, strips and nuggets. Inflation is increasing consumer awareness of value with chicken benefitting at the expense of beef and pork
 
|
Turkey Month
|
11/25/2024 |
|
Monthly Turkey Production and Prices, November 27th 2024
Poult Production and Placement:
The November 17th 2024 edition of the USDA Turkey Hatchery Report, issued monthly, documented 24.98 million eggs in incubators on November 1st 2024 compared to 25.54 million eggs on November 1st 2023* The November 2024 set was down 0.56 million eggs (2.2 percent) from November 2023 and 32,000 eggs (less than 0.1 percent percent) from than the previous month of October 2024.
A total of 20.73 million poults were hatched during October 2024 down 1.94 million poults (8.5 percent) compared to 22.67 million in October 2023*. The October 2024 hatch was up 0.50 million poults (2.5 percent) from the previous month of September.
A total of 18.77 million poults were placed on farms in the U.S. in October 2024, compared to 20.65 million in October 2023*. The October 2024 placement was 0.85 million poults (4.7 percent) more than in September 2024. This data confirms disposal of 1.96 million poults during the month. Approximately 9.5 percent of the October 2024 hatch was not placed.
For the twelve-month period November 2023 through October 2024 inclusive, 252.39 million poults were hatched and 235.70 million were placed. This confirms disposal of 16.69 million poults over the 12-month period, corresponding to 6.6 percent of all poults hatched.
* USDA revision from previous monthly report.
P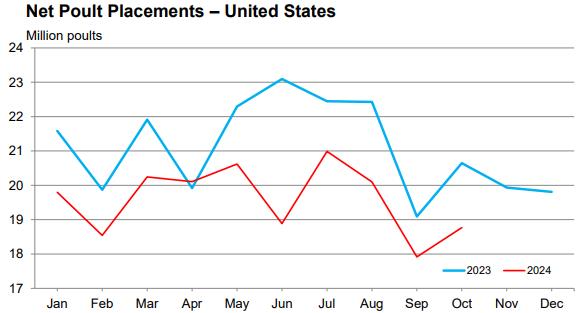 |
|
Meat Exports
|
11/19/2024 |
|
U.S. Broiler and Turkey Exports, January-September 2024.
OVERVIEW
 Total exports of bone-in broiler parts and feet during January-September 2024 attained 2,441,412 metric tons, 10.5 percent lower than in January-September 2023 (2,728,128 metric tons). Total value of broiler exports decreased by 3.0 percent to $3,441 million ($3,548 million). Total exports of bone-in broiler parts and feet during January-September 2024 attained 2,441,412 metric tons, 10.5 percent lower than in January-September 2023 (2,728,128 metric tons). Total value of broiler exports decreased by 3.0 percent to $3,441 million ($3,548 million).
Total export volume of turkey products during January-September 2024 attained 164,124 metric tons, 4.9 percent more than in January-September 2023 (156,421 metric tons). Total value of turkey exports increased by 8.6 percent to $490.5 million ($451.6 million).
Unit price for the broiler industry is constrained by the fact that leg quarters comprise over 96 percent of broiler meat exports by volume (excluding feet). From the first quarter of 2021 through late 2022, the value of leg quarters increased in unit value consistent with international demand but followed by a decline in 2023. Leg quarters represent a relatively low-value undifferentiated commodity lacking in pricing power. Exporters of commodities are subjected to competition from domestic production in importing nations. Generic products such as leg quarters are vulnerable to trade disputes and embargos based on real or contrived disease restrictions. To increase sales volume and value the U.S. industry will have to become more customer-centric following the lead of Brazil offering value-added presentations with attributes required by importers. Whether this will increase margins is questionable given the by-product contribution of leg quarters. A more profitable strategy for the U.S. industry would be to develop products using dark meat to compete with and displace pork and beef in the domestic retail and institutional markets.

HPAI is now accepted to be a panornitic affecting the poultry meat industries of five continents with seasonal and sporadic outbreaks. The incidence rate and location of cases in the U.S. limits eligibility for export depending on restrictions imposed by importing nations
Ongoing outbreaks of African swine fever in China and Southeast Asia from early 2019 and Europe from 2020 onwards reduced the availability of pork. In addition, disruptions in chicken production and logistics due to COVID restrictions decreased availability of protein with international repercussions on trade in chicken and pork. The demand for pork imports to China has diminished with restoration of domestic hog production to the extent of overproduction. Mild oversupply is evident in the white-feathered broiler sector with implications for exports other than feet extending into 2024.
|
Meat Projection Nov 2024
|
11/18/2024 |
|
 Updated USDA-ERS Poultry Meat Projection for November 2024. Updated USDA-ERS Poultry Meat Projection for November 2024.
On November 15th 2024 the USDA-Economic Research Service released updated production and consumption data with respect to broilers and turkeys, covering 2023 a projection for 2024 and a forecast for 2025.
The 2024 projection for broiler production is 47,184 million lbs. (21.417 million metric tons) up 1.7 percent from 2023. USDA projected per capita consumption of 102.4 lbs. (46.5 kg.) for 2024, up 3.4 percent from 2023. Exports will attain 6,717 million lbs. (3.053 million metric tons), 7.5 percent below the previous year.
The 2025 USDA forecast for broiler production will be 47,850 million lbs. (21.750 million metric tons) up 1.4 percent from 2024 with per capita consumption up 1.0 lb. to 103.1 lbs. (46.9 kg). Exports will be 1.3 percent higher compared to 2024 at 6,780 million lbs. (3.081 million metric tons), equivalent to 14.2 percent of production.
Production values for the broiler and turkey segments of the U.S. poultry meat industry are tabulated below:-
|
Parameter
|
2023
(actual)
|
2024
(projection)
|
2025
(forecast)
|
Difference
2023 to 2024
|
|
Broilers
|
|
|
|
|
|
Production (million lbs.)
|
46,387
|
47,184
|
47,850
|
+1.4
|
|
Consumption (lbs. per capita)
|
99.5
|
102.4
|
103.1
|
+2.6
|
|
Exports (million lbs.)
|
7,260
|
6,717
|
6,780
|
-7.5
|
|
Proportion of production (%)
|
15.7
|
14.2
|
14.2
|
-9.5
|
|
|
|
|
|
|
|
Turkeys
|
|
|
|
|
|
Production (million lbs.)
|
5,457
|
5,122
|
5,165
|
-6.1
|
|
Consumption (lbs. per capita)
|
14.8
|
13.9
|
13.7
|
-6.1
|
|
Exports (million lbs.)
|
490
|
502
|
530
|
+2.9
|
|
Proportion of production (%)
|
9.0
|
9.8
|
10.3
|
+10.0
|
Source: Livestock, Dairy and Poultry Outlook released November 15th 2024
The November USDA report updated projection for the turkey industry for 2024 including annual production of 5,122 million lbs. (2.328 million metric tons), down 6.1 percent from 2023. Consumption in 2024 is projected to be 13.9 lbs. (6.3 kg.) per capita, down 6.1 percent from the previous year. Export volume will increase by 2.5 percent in 2024 to 502 million lbs. (228,000 metric tons). Values for production and consumption of RTC turkey in 2024 are considered to be realistic, given year to date data, the prevailing economy, variable weekly poult placements, production levels, limited losses from HPAI and inventories consistent with season.
The 2025 forecast for turkey production is 5,165 million lbs. (2.348 million metric tons) up 0.8 percent from 2024 with per capita consumption down 1.4 percent to 13.7 lbs. (6.2 kg). Exports will be 5.6 percent higher than in 2024 to 530 million lbs. (240,910 metric tons) equivalent to 10.3 percent of production.
Export projections do not allow for a breakdown in trade relations with existing major partners including Mexico, Canada and China nor the impact of catastrophic diseases including HPAI and vvND in either the U.S. or importing nations
Compared to 2023 exports of broiler products to China during 2024 were 34 percent lower in volume to 405,343 metric tons and 34 percent lower in value to $711 million. For the first half of 2024 broiler volume to 4th-ranked China by volume of imports was down 62 percent from the corresponding months in 2023 to 92,069 metric tons. Value was down 54 percent to $183 million
Subscribers are referred to the monthly export report in this edition and update of production data and cold storage inventories of broilers and turkeys respectively posted in each end-of- month edition of CHICK-NEWS with the previous monthly data under the STATISTICS tab.
|
Poultry Meat Projection September 2024
|
09/20/2024 |
|
Updated USDA-ERS Poultry Meat Projection for September 2024.
On September 18th 2024 the USDA-Economic Research Service released updated production and consumption data with respect to broilers and turkeys, covering 2023 a projection for 2024 and a forecast for 2025.
The 2024 projection for broiler production is 47,109 million lbs. (21.403 million metric tons) up 1.6 percent from 2023. USDA projected per capita consumption of 102.0 lbs. (46.4 kg.) for 2024, up 2.6 percent from 2023. Exports will attain 6,766 million lbs. (3.075 million metric tons), 6.7 percent below the previous year.
The 2025 USDA forecast for broiler production will be 47,675 million lbs. (21.670 million metric tons) up 1.2 percent from 2024 with per capita consumption up 0.5 lb. to 102.5 lbs. (46.6 kg). Exports will be 1.6 percent higher compared to 2024 at 6,875 million lbs. (3.125 million metric tons), equivalent to 14.5 percent of production.
Production values for the broiler and turkey segments of the U.S. poultry meat industry are tabulated below:-
|
Parameter
|
2023
(actual)
|
2024
(projection)
|
2025
(forecast)
|
Difference
2023 to 2024
|
|
Broilers
|
|
|
|
|
|
Production (million lbs.)
|
46,387
|
47,109
|
47,675
|
+1.6
|
|
Consumption (lbs. per capita)
|
99.5
|
102.0
|
102.5
|
+2.5
|
|
Exports (million lbs.)
|
7,260
|
6,776
|
6,875
|
-6.8
|
|
Proportion of production (%)
|
15.7
|
14.4
|
14.4
|
-8.3
|
|
|
|
|
|
|
|
Turkeys
|
|
|
|
|
|
Production (million lbs.)
|
5,457
|
5,130
|
5,175
|
-6.0
|
|
Consumption (lbs. per capita)
|
14.8
|
13.9
|
13.8
|
-6.1
|
|
Exports (million lbs.)
|
490
|
507
|
530
|
+3.5
|
|
Proportion of production (%)
|
9.0
|
9.9
|
10.2
|
+10.0
|
Source: Livestock, Dairy and Poultry Outlook released September 18th 2024
The September USDA report updated projection for the turkey industry for 2024 including annual production of 5,130 million lbs. (2.332 million metric tons), down 6.0 percent from 2023. Consumption in 2024 is projected to be 13.9 lbs. (6.3 kg.) per capita, down 6.1 percent from the previous year. Export volume will increase by 3.5 percent in 2024 to 507 million lbs. (230,455 metric tons). Values for production and consumption of RTC turkey in 2024 are considered to be realistic, given year to date data, the prevailing economy, variable weekly poult placements, production levels, freedom from HPAI and inventories.
The 2025 forecast for turkey production is 5,175 million lbs. (2.352 million metric tons) up 1.2 percent from 2024 with per capita consumption down 0.7 percent to 13.8 lbs. (6.3 kg). Exports will be 5.0 percent higher than in 2024 to 530 million lbs. (240,910 metric tons) equivalent to 10.0 percent of production.
Export projections do not allow for a breakdown in trade relations with existing major partners including Mexico, Canada and China nor the impact of catastrophic diseases including HPAI and vvND in either the U.S. or importing nations
Compared to 2022 exports of broiler products to China during 2024 were 34 percent lower in volume to 405,343 metric tons and 34 percent lower in value to $711 million. For the first half of 2024 broiler volume to 4th-ranked China by volume of imports was down 62 percent from the corresponding months in 2023 to 92,069 metric tons. Value was down 54 percent to $183 million
Subscribers are referred to the monthly export report in this edition and update of production data and cold storage inventories of broilers and turkeys respectively posted in each end-of- month edition of CHICK-NEWS with the previous monthly data under the STATISTICS tab.
|
USDA Export Projections For Chicken
|
09/02/2022 |
|
 Based on the August 12th, 2022 World Agricultural Supply and Demand Estimates, USDA has projected chicken exports for 2022 with a forecast for 2023. Based on the August 12th, 2022 World Agricultural Supply and Demand Estimates, USDA has projected chicken exports for 2022 with a forecast for 2023.
Broiler meat exports will amount to 3.3 million metric tons in 2022 valued at $4.2 billion. For 2023, volume and value will be unchanged, representing a unit price excluding feet, which are not federally inspected, at $1,272 per metric ton.
 The 2023 exports of all agricultural products will amount to $193.5 billion in 2023, balanced by imports of $197.0 billion resulting in a negative annual balance of $3.5 billion. The 2023 exports of all agricultural products will amount to $193.5 billion in 2023, balanced by imports of $197.0 billion resulting in a negative annual balance of $3.5 billion.
|
|
|
|

|
| |
Copyright © 2025 Simon M. Shane
|
|
|